This article will attempt to answer three basic questions about Tableau: what it is, how it works, and why it’s helpful. We’ll explore the products associated with Tableau Software and how they’re useful and address the elephant in the room: how does Tableau compare to Excel?
Ultimately, we aim to provide an answer to the question: Is Tableau worth it?
What Is Tableau?
Tableau Software is a fast-growing data visualization tool that’s making a splash in the Business Intelligence (BI) industry. The easiest way to describe what Tableau does is that it aims to help simplify raw data into an easily understandable format for people with or without technical knowledge.
It analyzes data quite fast and creates visualizations (dashboards and worksheets) that bitesize the information and make it easily digestible by everyone. Simply put, Tableau helps everyone grasp data better.
Tableau is useful for:
- Managing metadata
- Importing data, regardless of size and ranges
- Translating queries into visualization
- Creating “no-code” data queries
Why Data Visualization Matters

If you’re wondering what the point is in using a data visualization tool, know that it’s quite important. It’s crucial in presentations, conferences, anything really, and mostly because people are visual creatures.
If you present a group of people with dry data, it won’t make the same impact as it would have if you had added a visual aid to it. Visualization makes digesting data and understanding what it means a much simpler process.
Well-designed graphics and charts help you get your point across better than mere words alone could.
Who Is Tableau For?
Anyone can learn how to use Tableau. You don’t need any special skill or knowledge for it. You don’t have to know any coding or be a technical person to use it, so that shouldn’t deter you from giving it a shot.
Here are some of Tableau’s best perks:
- Easy to use
- Collaboration of data
- Data blending
- Real-time analysis
How Does Tableau Work?
Tableau both connects and extracts data stored in different places. In fact, where it’s stored doesn’t matter because it can pull information from any platform you can imagine and use it for its analysis. It can take data from Excel, PDF, Oracle, Amazon web services, Microsoft Azure SQL database, Google Cloud SQL, the list goes on and on.
Once you launch Tableau, you can connect to any database, pull information, and either connect in real-time or extract it to Tableau Desktop, which is Tableau’s data engine.
The data analyst or data engineer then works with the newly pulled data and creates visualizations that get shared as a static file. You can view that file through Tableau Reader.
If you want, you can publish the information to the Tableau Server. Tableau Server is a platform that supports collaboration, distribution, and automation, among others. The Tableau Server can be accessed through both phone and desktop, regardless of location, which is yet another great convenience.
Tableau is devised as a one-stop-shop platform for ease and convenience for all users, so all you need is right there.
Tableau Products

Tableau’s data analytics tools fall under two sections—Developer Tools and Sharing Tools. As the names let on, the first covers tools used for development, and the latter covers ones for sharing.
Developer Tools help you create reports, charts, dashboards, and so on, and the products associated with that section are Tableau Desktop and Tableau Public.
Sharing Tools help you share your creations, and the products attributed to that are Tableau Online, Tableau Server, and Tableau Reader.
1. Tableau Desktop: Personal and Professional
Tableau Desktop lets you code and modify reports. You can create charts, graphs, and reports and combine them into a dashboard. It’s divided into two services: Tableau Desktop Personal and Tableau Desktop Professional.
The first offers limited access and a private mode for the workbook, which is only for personal use and can’t be posted. And the latter allows the work to get published on the Tableau Server.
2. Tableau Public
Tableau Public is a budget-friendly tool as it’s free for the public. You can use it to send workbooks to Tableau’s public cloud, and then those workbooks can get viewed and accessed by the general public.
3. Tableau Reader
Tableau Reader lets you view the visualizations and workbooks created via Tableau Public or Tableau Desktop. You can filter the data, but if you want to modify it, there are limitations you have to abide by.
Tableau Reader allows anyone to view the workbook, which can lead to security risks, and that’s something you have to keep in mind.
4. Tableau Server
Tableau Server allows you to share the visualizations and workbooks created using Tableau Desktop. When it comes to the Tableau Server, security is high, so that shouldn’t concern you.
5. Tableau Online
Tableau Online is a sharing tool. It lets you publish data and doesn’t have a set limit of how much you can store. Data gets saved on servers provided in the cloud that’s maintained by the Tableau group.
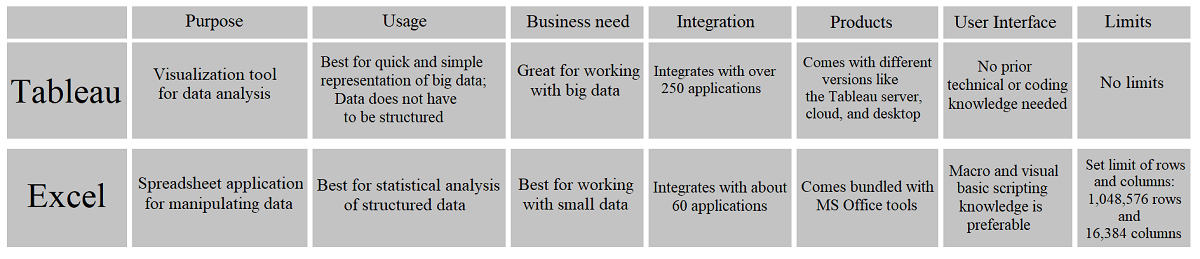
Tableau and Excel
Both Excel and Tableau are popular tools for data analysis. Excel works in spreadsheets, with columns and rows, whereas Tableau allows even the exploration of Excel data and formats everything in an easily understandable format: images, charts, graphs, and so on. You can see the chart below for a few key differences between the two.
Why Use Tableau?
One of the better features, if not the best feature, that Tableau offers is that it doesn’t require specialist knowledge. You don’t have to have a coding background or possess any technical know-how whatsoever. You can start using the tool today with no prior knowledge or programming skills.
A large part of its features are self-explanatory, and it even offers a drag-and-drop feature for extra convenience. It truly is made with users in mind.
Tableau allows you to connect to varying data sources, data warehouses, data from spreadsheets, files that reside in the cloud, and more. It then blends all that information, helps you analyze it, explore visualizations, and look at the same data from different angles. You can switch between different visualizations and bring about a greater context.
And, you can also work with data that’s in no particular order and use it to generate an array of visualizations. It’s a convenient visualization tool, and it’s worth it to give it a try.