Since the beginning of modern project management strategies in the 1950s, several chart-based project governance techniques have evolved. One of them is the Gantt chart, but it can only show task progress, and hence research went on. An ultimate creation is the PERT or Program, Evaluation, and Review Technique chart.
This project planning, execution, and management tool shows you more data during the project progress. This article will help you understand and implement a PERT chart for productive project management.
What Is a PERT Chart?
window.arrayOfEmbeds[“i160aaBX7mE”] = {’embedded_youtube’ : ‘”“‘};
PERT chart is a schematic representation of the key timeline and milestones of any project. This graphical project planning and progress visualization technique came into existence for the first time through the Polaris submarine project of the U.S. Navy.
Project managers have since then tested the PERT network diagram in many projects. They mainly try to figure out the project duration by analyzing task sequences in a PERT chart. At present, every industry uses this technique to plan and execute complex projects in a simple yet efficient way.
Reasons to Use PERT Charts in Project Management

Project managers and team members use PERT charts to estimate resources and project periods. Further, when the project moves on, you can also know task scheduling, tasks order, milestones, and stages of any project.
Project owners, managers, and team members use PERT charts for the following reasons:
1. Remove Project Complexities
When you break down the project structure using a PERT chart, you’ll see task dependencies and task complexities. This overall visualization effectively converts complex projects to simpler ones while managing them.
2. Effortlessly Involve More Experts and Teams
When you use a PERT chart, every responsible team becomes efficient in discharging their responsibilities during the project. You also get more insight on team duties and their abilities to perform those.
Due to its simplicity, every department can use this tool to monitor their part of the project. Later on, you can merge all PERT charts from different teams to gather valuable project intelligence.
3. Experiment Hypothetical Scenarios
Project managers can create what-if scenarios by using PERT charts. They get to know what’s working and what’s not during the ongoing project. They can also experiment with resources, time, and cost without impacting the actual project.
4. Predict Deadlines Accurately
PERT charts show you a clear order of project progress while you’re planning the project. Therefore, you can accurately predict deadlines to impress the client.
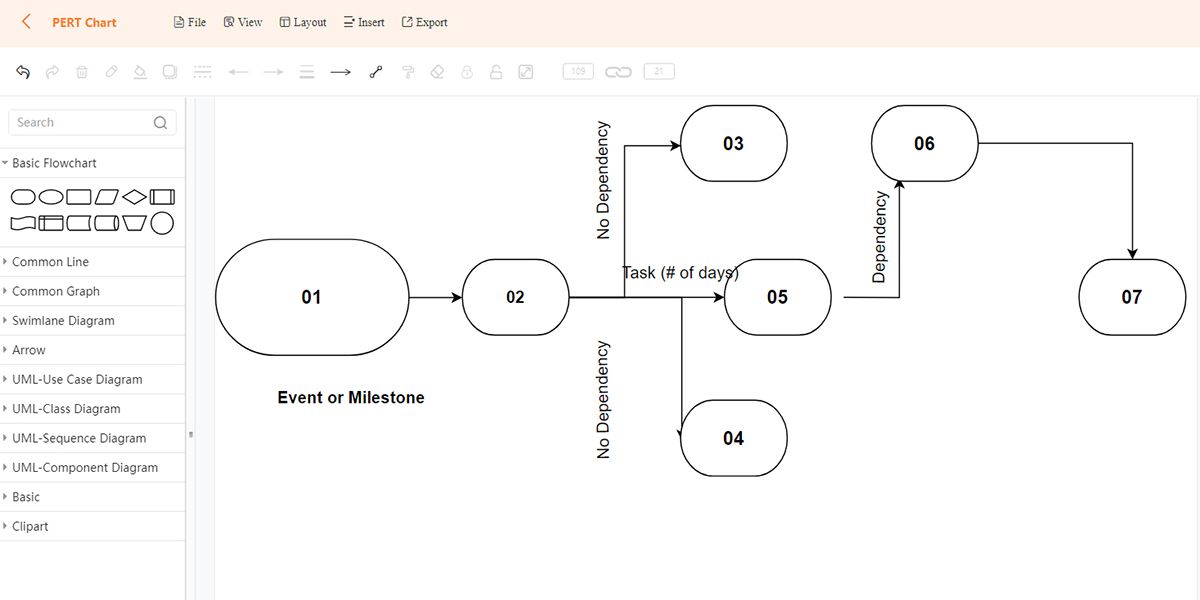
Components of PERT Chart

The first step towards implementing a PERT chart is to understand its components. Take a look at the following elements of a PERT chart:
- Arrows represent the sequential manner of task organization. Depending on the nature of the sequence, arrows could be solid or dotted.
- Circles or triangles in a PERT chart are the Nodes. Nodes visualize tasks or milestones.
- Slack or Float is the time delay a project can afford without delaying the overall deadline.
- Lead Time is the period where two activities overlay.
- Lag Time is the delay or wait-time between two tasks.
- Fast Tracking Time is the scenario when more than one critical tasks progress simultaneously.
- Any task with the longest sequence in the project is a Critical Path. Critical paths help in determining project duration.
- PERT Event is the point where one task ends and the next one begins.
How to Draw a PERT Chart
window.arrayOfEmbeds[“Gyq0v8l6uGE”] = {’embedded_youtube’ : ‘”“‘};
You need to create a PERT chart during the project planning phase. The followings are the basic steps to draw any PERT chart:
- Identify project milestones.
- Make each project milestone an individual task.
- Find out task dependencies and task sequences.
- Perform time estimation of each task.
- Now, you need to calculate the critical path and see if the project can afford any slack.
- Draw the PERT chart in a network diagram tool. Keep it updated as it is the living document to track your project progress.
How to Interpret PERT Charts
window.arrayOfEmbeds[“-TDh-5n90vk”] = {’embedded_youtube’ : ‘”“‘};
By interpreting a PERT chart, you get to know the series of activities that happen during the project’s lifetime. These are the points that help you interpret any PERT chart:
- The direction of an arrow points out the sequence and flow of events to complete any project.
- Dotted arrows are dummy tasks. You’ll find these tasks on another PERT path.
- Each vector will show its number and allocated time.
- Any mention of Optimistic time means the best possible short duration.
- On the contrary, Pessimistic time means the longest possible time for any task in a logical sense.
- Most likely time refers to a rational guess of the best-case scenario.
- Expected time means an estimation of task completion, supposing there will be issues.
Tools to Create PERT Chart
There are many cost-effective cloud-based tools that you can use to make PERT charts. Using such tools automates the PERT formula and standard deviation calculations. Followings are some of the best tools that you can try out:
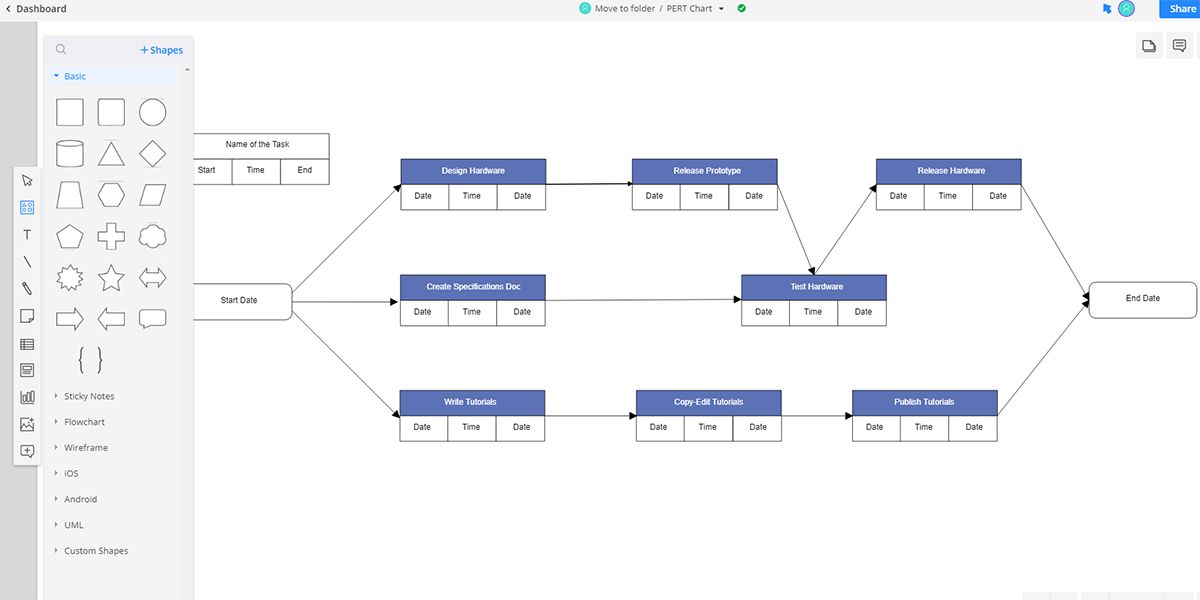
Lucidchart
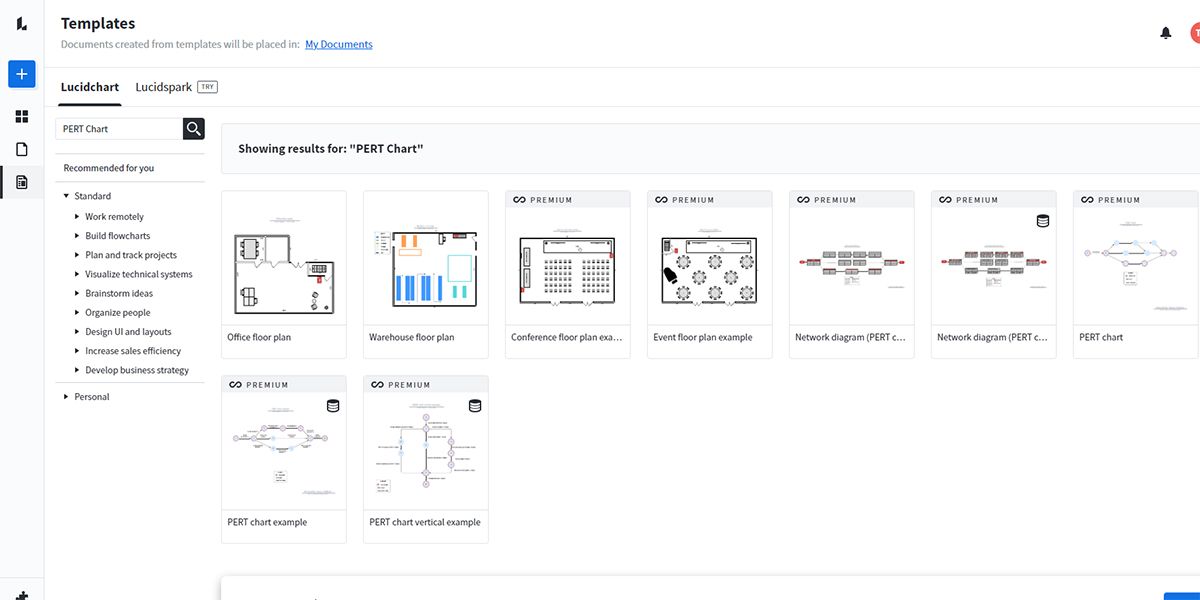
Lucidchart is one of the best diagramming applications with built-in AI for collaborative work. You can get started for free. Lucidchart free plan gives you access to three documents and up to 100 professional templates.
The tool has some highly efficient and professional-looking PERT chart templates to choose from.
Cacoo
Cacoo is another top-notch cloud-based flow charting app. You can brainstorm, plan, gather feedback, and present anything related to the PERT chart that you’re making. You, your team, and the client can work on the same PERT chart in real-time.
The subscription is $5/mo (billed annually) or $6/month (billed monthly) with two months free. Cacoo also offers a credit-card-free trial subscription.
Visme
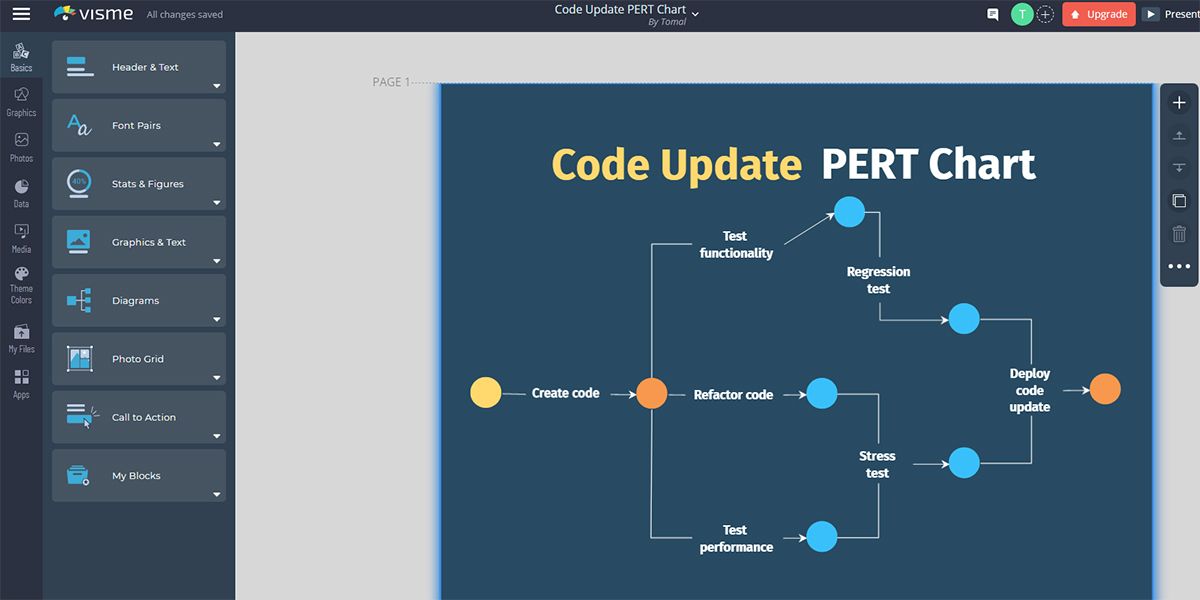
Visme is a trending app to draw diagrams and flowcharts. It offers a PERT Chart Generator for easy project management. The tools offer many modern features like drag-and-drop creator, connect shapes & lines, and customize almost everything.
It offers a free subscription where you get up to five projects, 100 MB of storage, converts diagrams to JPG, and limited templates.
GitMind
If you’re a perfectionist and willing to make your own PERT chart from scratch, you can try out GitMind. It’s a free mind mapping tool that supports the creation of modern diagrams and flowcharts.
The tool has an elaborate list of drawing elements, themes, and customizations. Furthermore, you can share the PERT chart with clients for collaborative work. If you need to send a PERT chart file to someone, export your work in several formats like JPG, PNG, DOC, PDF, etc.
Drive Project Management Towards Ultimate Productivity
Now that you know more about PERT charts and the tools to create them, you can give this project planning or management tool a try. The PERT charts are truly helpful when you’re driving the project to productive completion without taking any wrong steps. Further, you can value add project productivity by avoiding the usual slips of project management.