1
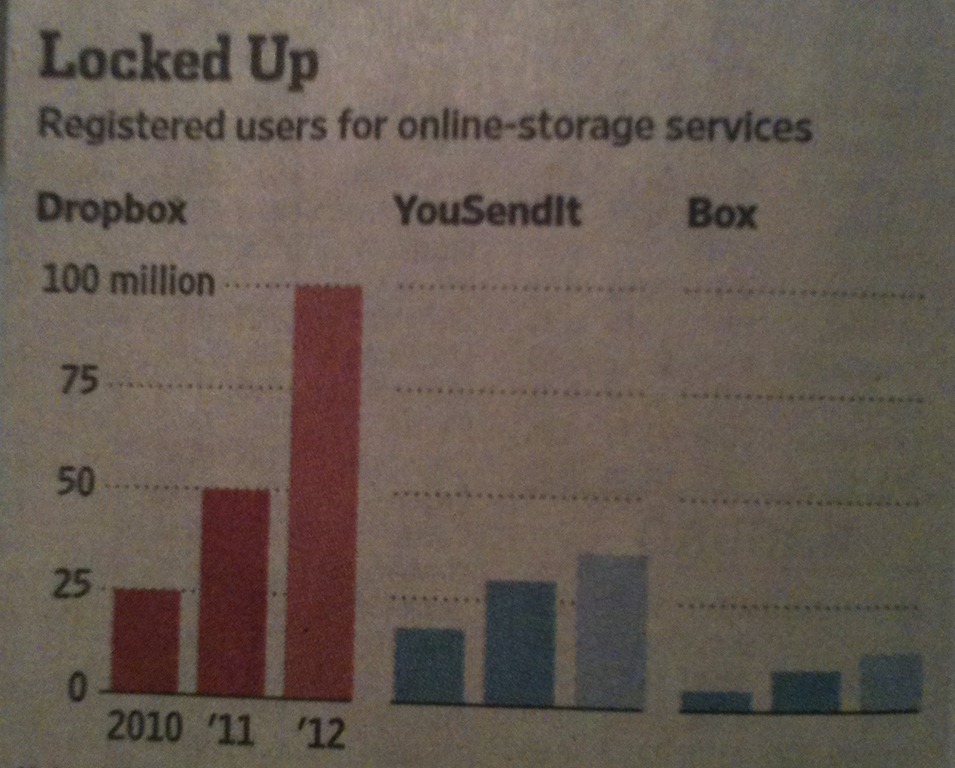
A panel chart is two or more smaller charts combined into one, allowing you to compare data sets at a glance. Since these charts have the same axes and scale, with a clear dividing line between the different data sets, you quickly get a feel of the information presented.