0
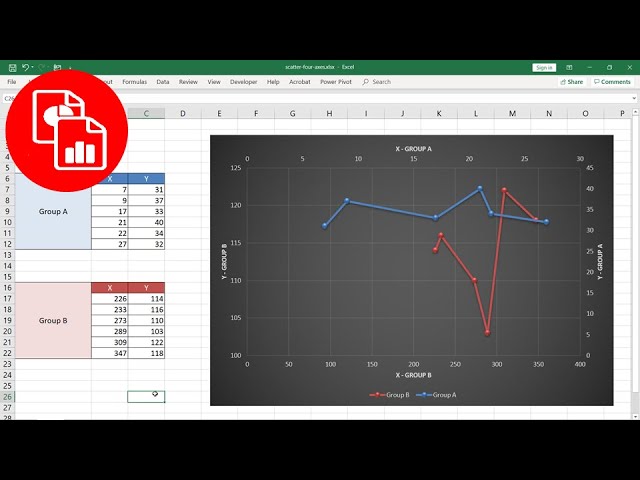
When plotting multiple dependent variables, using a shared y-axis scale can create an inaccurate picture of their true relationship. Often, the solution is to use a graph with two y-axes.
When plotting multiple dependent variables, using a shared y-axis scale can create an inaccurate picture of their true relationship. Often, the solution is to use a graph with two y-axes.